Add a dashboard theme – Visualize and analyze the data
Add a dashboard theme
You can apply a theme to a dashboard similar to how you apply a theme to a report. This technique can be especially beneficial if you want to apply a uniform theme to a dashboard that has visuals from reports with different themes.
To configure the dashboard theme, select Edit > Dashboard theme. From the dropdown list, select a preconfigured theme, or you can create a custom theme. For example, Figure 3-30 shows the color-blind friendly theme.
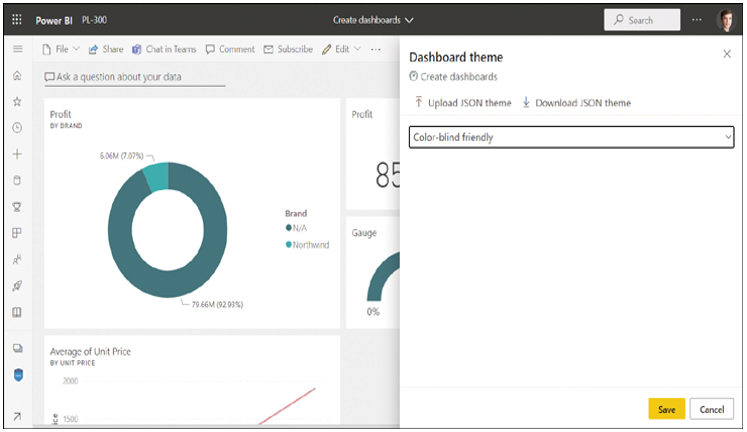
FIGURE 3-30 Dashboard theme options.
If you select Custom from the dropdown list, you can set the background image and color, as well as tile background, font color, and opacity, as shown in Figure 3-31.
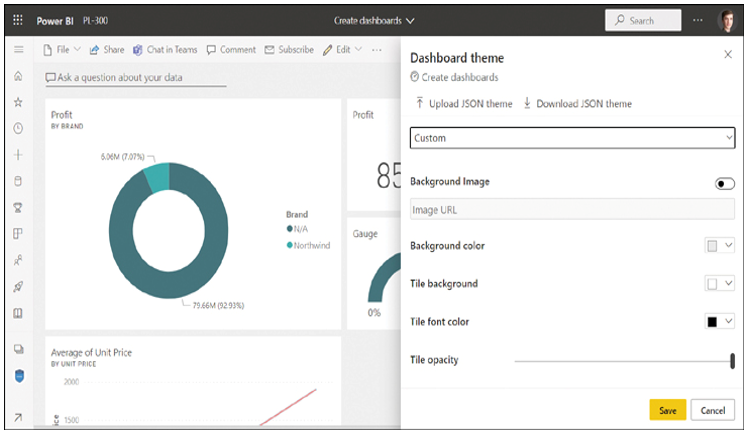
FIGURE 3-31 Custom theme options.
To set a background image, you must provide a publicly accessible URL, because uploading images isn’t supported.
You can download the theme you create by selecting Download JSON theme.
To add a more sophisticated theme, you can upload your own JSON theme by selecting Upload JSON theme.
Note JSON Themes
The structure of a dashboard JSON theme is the same as that of a report theme. The technical details of JSON theme files are out of the scope of this book.
You can download various themes from the Power BI Themes Gallery at https://community.powerbi.com/t5/Themes-Gallery/bd-p/ThemesGallery.
Pin a live report page to a dashboard
There are a couple of limitations of pinned visuals: they can’t cross-filter and interact with each other, and you can pin only one visual at a time.
Pinning a live report page to a dashboard overcomes both limitations. You can simultaneously pin multiple visuals on a dashboard, and the visuals then become interactive.
To pin a live page to a dashboard, go to the desired report page in the Power BI service and select Pin to a dashboard from the top menu. Power BI asks you to select a dashboard to pin the page to, as shown in Figure 3-32.
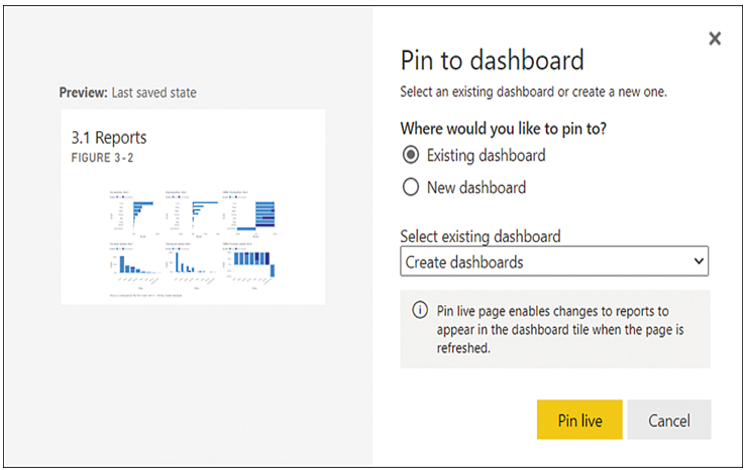
FIGURE 3-32 Pin live page.
Selecting Pin live will pin the report page to a dashboard as a tile. You can then edit, move, and resize the tile as needed. Note that visuals within the tile are interactive; as with reports, you can use slicers and filter visuals by selecting other visuals.