Configure navigation for a report – Visualize and analyze the data
Configure navigation for a report
Besides using the page bar for navigation in the report, you can configure page or bookmark navigators, which work similarly to buttons or slicers. To add a page or button navigator to the canvas, select Insert > Buttons > Navigator > Page navigator or Bookmark navigator.
If we used the same bookmarks as earlier in this section, our bookmark navigator would look like Figure 3-39.
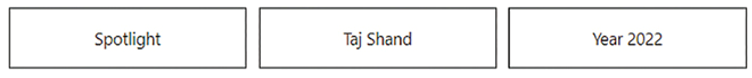
FIGURE 3-39 Bookmark navigator.
The page or bookmark navigator will update as you add pages or bookmarks, respectively.
Additionally, you can configure some visualization items, such as buttons, to link to specific pages or bookmarks by performing the following steps:
Select an existing visualization item or insert a new one from the Insert ribbon.
With the item selected, in the Format pane set the Action toggle to On.
Expand the Action section.
Select Page navigation or Bookmark from the Type list to go to a page or bookmark, respectively. Depending on your selection, the Destination or Bookmark list will then appear in the Action section.
Select the desired page or bookmark from the Destination or Bookmark list, respectively.
At this stage, if you hold the Ctrl key on your keyboard and select the visualization item, you will be taken to the page or bookmark you linked the item to. You can create more links to other pages or bookmarks for more interactive navigation using the same technique.
Note Power BI Service
When you are in reading view in the Power BI service, you do not need to hold the Ctrl key for navigation by using buttons, shapes, or images.
Apply sorting
When you create a visual, Power BI will try to sort the data in the most appropriate way. For example, column charts are usually sorted in descending order of values. You can apply different sorting according to your business requirements.
To change sorting of a visual, hover over it, select More options > Sort by, and select the field you want to sort by. To sort in descending or ascending order, hover over the visual and select More options > Sort descending or Sort ascending, respectively.
The Table visual supports sorting by multiple columns at the same time. In the Wide World Importers example, you can sort a table by two columns in the following way:
Create a table with the following fields:
- Year from the Date table (set summarization to Don’t summarize)
- Employee from the Employee table
- Profit from the Sale table (set summarization to Sum)
In the visual, select the header of the Year column. Ensure that the arrow in the header points up for ascending order. If it points down, select the header again.
Press and hold the Shift key.
Select the header of the Profit column. Ensure that the arrow in the header points down for descending order. If it points up, select the header again.
The result should look like Figure 3-40.
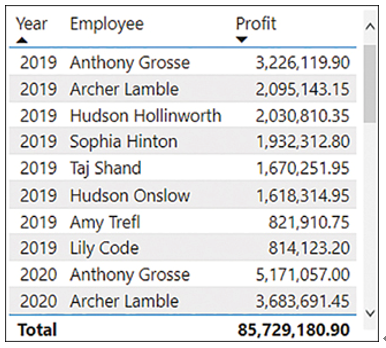
FIGURE 3-40 Table sorted by two fields.
Note Sort By Column
As discussed in Skill 2.1: Design a data model, you can also apply different sorting to columns in the data model—this feature is called Sort by column. When you use a sorted column on an axis in a visual, Power BI will usually sort the visual by this column instead of sorting by values.