Edit and configure interactions between visuals – Visualize and analyze the data
Edit and configure interactions between visuals
One of the defining features of Power BI is the interaction of visuals with each other. For example, you can select an item in a bar chart, and it will cross-highlight a column chart. This behavior is illustrated in Figure 3-37.
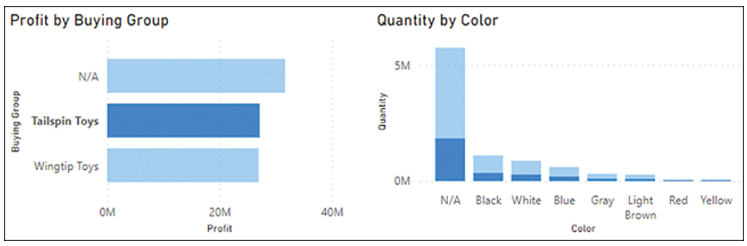
FIGURE 3-37 Cross-highlighting in action.
In Figure 3-37, we selected a bar that displays Profit for Tailspin Toys. The other bars in this graph then became dimmed, and portions of columns in the other visual became highlighted. These highlighted portions represent Quantity values in each Color that relate to Tailspin Toys. This behavior is called cross-highlighting: selecting a data point in a visual will highlight portions of other visuals.
To change this behavior, you can select the bar chart, after which the Format ribbon becomes visible. Select Format > Edit interactions. If you have more charts on the page, you’ll see new buttons appear in the top-right corner of other charts:
- Filter Only shows values that relate to the selected data point
- Highlight Highlights portions of visuals that relate to the selected data point
- None Ignores any selections
You can see the interaction buttons and the effect of each interaction option in Figure 3-38.
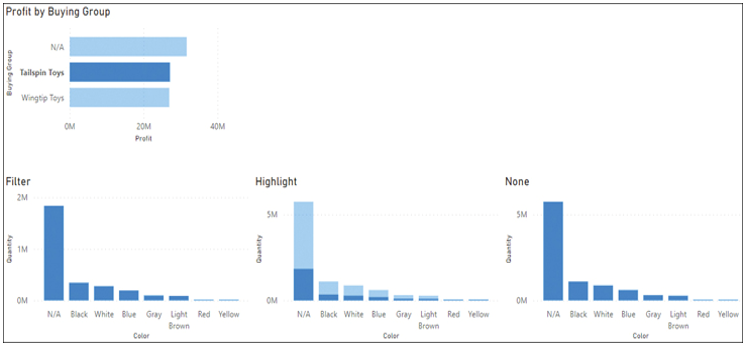
FIGURE 3-38 Three interaction options.
To hide the interaction buttons, select Format > Edit interactions again.
Not every visual type has all three interaction options; some only have two, such as Filter and None. For example, it is not possible to highlight part of a slicer or a card. In these cases, the default behavior will be Filter instead of Highlight.
Note Default Interaction
Highlight is the default interaction, which you can change to Filter in report settings: File > Options and settings > Options > Current file > Report settings > Change default visual interaction from cross highlighting to cross filtering.