Filters pane – Visualize and analyze the data
Filters pane
Besides slicers, you can apply filters by using the Filters pane on the right-hand side of the report, which has three sections:
- Filters on this visual These filters apply to a specific visual you select, and this section is visible only when you select a visual. You can use both measures and columns to filter on. Fields that are used in field wells of a visual will automatically appear here.
- Filters on this page These filters apply to all visuals on the currently selected page. It’s not possible to make certain visuals ignore these filters, and you can only use columns to filter on.
- Filters on all pages These filters apply to all visuals in the report across all pages. You can’t make specific visuals ignore these filters, and you can only use columns to filter on.
You can see the Filters pane in Figure 3-21.
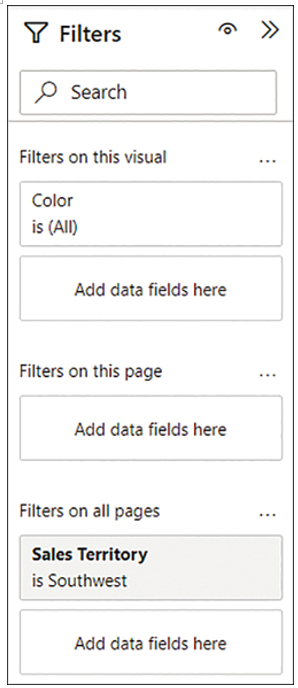
FIGURE 3-21 Filters pane.
Filters in the Filters pane are shown as filter cards. Cards with applied filters are shaded. In Figure 3-21, the Sales Territory filter card is shaded because it’s filtered to one value: Southwest. There are no filters on Color in Figure 3-21, so the card is not shaded.
You can add a field to the Filters pane in one of two ways:
- Drag a field from the Fields pane into a section in the Filters pane.
- Right-click a field in the Fields pane and select Add to filters, and then select the section you want to add the field to.
You can apply Basic filtering to any column, which corresponds to the List option in slicers. You can also select the Require single selection option if you want users to select only one value.
Depending on the data type of the field you’re adding, you’ll see different Advanced filtering options you can apply. For example, for Date/Time type columns, you have the option of filtering in a relative or a static time period, such as filtering for the last two calendar weeks. For Text type columns, you can filter when a column contains a certain value.
As with slicers, selections in a filter card can be cleared by selecting the Clear filter button that becomes visible when you hover over the filter card. Other buttons that become visible when you hover over a filter card include the following:
- Lock filter This locks the filter selections, preventing report viewers from changing them. To unlock the filter, select the Filter locked button.
- Hide filter This hides the filter card from report viewers.
- Remove filter This removes a filter card; not available for fields that are used in visuals.
Note Locking and Hiding Filters
Locking and hiding filters works only when you’re viewing a report published to the Power BI service. We review skills related to the Power BI service in Chapter 4, “Deploy and maintain assets.”
Note Filtering Filter Cards
A common technique to show a reduced number of values in a filter card is to add the same field twice and then filter and hide one of the cards. Removing one filter card does not remove the other.
You can search for filters in the Filters pane in the same way you search in the Fields pane. You can also sort and reorder the filter cards.
You can always check which filters affect a certain visual by hovering over its filter button on the visual header, as shown in Figure 3-22.
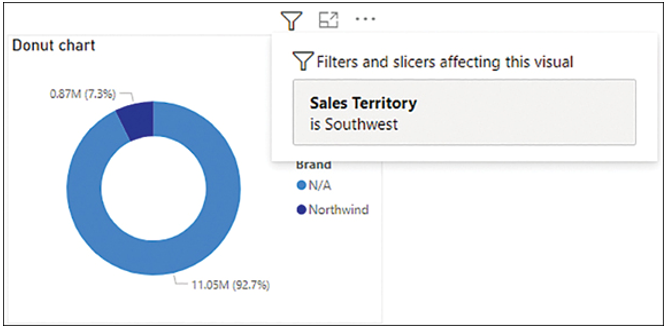
FIGURE 3-22 Filters and slicers affecting this visual.